SigmaPlot     SigmaStat     SYSTAT     TableCurve 2D     TableCurve 3D     PeakFit     SigmaPlot EK-Modul     SigmaPlot-Module    


Die neue SigmaPlot Version 15 ist da!


TableCurve 2D   TableCurve 3D   PeakFit   SYSTAT   SigmaStat   SigmaPlot   Elektrophysiologie-Modul

Wir präsentieren:

SigmaPlot-Webinar am Dienstag, 22.8.2023, 11-12 Uhr
  • Data to presentation with SigmaPlot 15
Programm und Anmeldung unter Data to presentation with SigmaPlot 15

TechTips

In our Newsletter we send Tech Tips for SigmaPlot and our other programs.

Subscribe here: saveskontakt@inpixon.com.

Newsletter
EN
January 2017 html
*  Outliers in Box Plots pdf
*  Formatting Worksheet Areas pdf
October 2016 html
*  The Column Statistics Window pdf
*  Percentage Histogram pdf
*  Percentile Methods pdf
July-August 2016 html
*  Export worksheet data as formatted (decimal places) to the clipboard pdf
*  Graphing raw and cumulated values pdf
March 2016 html
*  How to re-assign data to a plot? pdf
*  Align Objects on the Graph Page pdf
*  Unindex One-way 2 Columns pdf
January 2016 html
*  Lookup Transform pdf
*  Point Plots and Dot Plots pdf
*  Adding the Close All button to the Quick Access Toolbar pdf
November 2015 html
*  Freeze Panes in the SigmaPlot worksheet: Columns, Rows, and Sections pdf
*  User-Defined Functions (UDFs) with TableCurve 2D and TableCurve 3D - Part 2, Adjusting Parameters pdf
*  How to use the "interpolate" transform function pdf
September 2015 html
*  Function keys and keyboard shortcuts with SigmaPlot pdf
*  User-Defined Functions (UDFs) mit TableCurve 2D und TableCurve 3D pdf
*  Run Excel from a SigmaPlot macro pdf
July 2015 html
*  Error Bar Directions pdf
*  SigmaPlot Statistics Result Graphs pdf
*  Moving a network license to another machine pdf
March 2015 html
*  Interpolation issues with Mesh and Contour graphs pdf
*  Rearranging Notebook Items pdf
*  Publication Assistant pdf
January 2015 html
*  Category Plot pdf
*  Global Graph Attribute Changes pdf
*  Parallel Lines Analysis Macro pdf
November 2014 html
*  Data Table from an Equation pdf
*  Editing a Graph Gallery Graph html
September 2014 html
*  Flexible Legends in SigmaPlot 13 pdf
*  Creating a Candlestick Graph pdf
*  Histogram with Kernel Density Macro pdf
July 2014 html
*  Histograms pdf
May 2014 html
*  X Direction Confidence Intervals - Interpolation pdf
*  Merge Columns Macro pdf
*  Category Axis pdf
March 2014 html
*  Colorline Graph pdf
*  Statistical Transforms - Center and Normalize pdf
*  Floating Bar Graph pdf
January 2014 html
*  Plot and Solve Equations pdf
*  The Color Transition Values Macro pdf
November 2013 html
*  Bubble plot – adjusting the bubble sizes pdf
*  Adding axes pdf
*  Splitting groups of data from one column into multiple columns (unindex) pdf
September 2013 html
*  Axis breaks in a graph a with customized axis ("from column") pdf
*  Normal Distribution Comparison-Macro pdf
*  Text as symbols, and labels added to symbols pdf
July 2013 html
*  UI Panels: Turn off and on UI elements pdf
*  Rearranging worksheet data: From 1 to many columns pdf
*  Simple, Multiple, and Complex Area Plots pdf
May 2013 html
*  Arranging and aligning Graphs (and other Objects on the Graph Page) pdf
*  Quick Transforms with Automatic Update pdf
*  The "Rank and Percentile" macro pdf
November 2012 html
*  SigmaPlot user files, where are they, what are they? pdf
September 2012 html
*  Border Plots pdf
*  Boxplots from statistical parameters pdf
*  Using Column Titles as Tick Labels, with a User-Defined Transform pdf
July 2012 html
*  The Create Graph Tab in the Quickstart Wizard pdf
*  Cursor Position and Data-Feedback pdf
*  Column Titles in the Worksheet pdf
May 2012 html
*  File formats and import steps pdf
*  Decimal sign in SigmaPlot pdf
*  Utilities for decimal sign conversion pdf
March 2012 html
*  Adding Graph Page and Data Worksheet Icons to the Quick Access Toolbar pdf
*  Multi-row axis tick labels pdf
*  Macro Quick Re-Plot: Pick new data for a plot pdf
January 2012 html
*  Grouped Box Plots pdf
*  Arranging data worksheet and graph page pdf
*  The Menu To Ribbon Utility pdf
*  Macro: Add the notebook file name to the graph page pdf
November 2011 html
*  Adding an equation to the standard fit library pdf
*  SigmaPlot on a netbook computer (turning off the permanent display of the ribbons) pdf
*  Macro: Compute the area under a curve pdf
July 2011 html
*  Label Symbols Macro pdf
*  Adding a macro to the standard macro library pdf
*  Adding a macro to the "Tools" section of the ToolBox ribbon pdf
*  Adding an equation to the EK module pdf
May 2011 html
*  Stacked bar graph with error bars pdf
*  Arrhenius Graph pdf
September 2010 html
*  Farbe - die dritte Dimension in einem 2D Bar Graph (DE) pdf
*  "Howto" - Graphen auf der Seite verschieben und anordnen (DE) pdf
May 2010 html
*  Whitepaper: "Using Global Curve Fitting to Determine Dose Response Parallelism" pdf
*  SigmaPlot Data Smoothing html
*  Graph mit gruppierten und gestapelten Balken (DE) html
*  Nutzung von Fonts als Symbol (DE) html
*  Nutzung der Zeichentabelle als Symbol für Achsenbeschriftung (DE) html
December 2009 pdf
*  SigmaScan Pro-Makro: "Batch Analysis of Digital Images to Evaluate Turfgrass Characteristics" (Downloads...)
*  Macro: Turf Analysis.bas
*  Macro: Turf Analysis 1-2.bas
*  Festlegung der Fehlerbalken-Richtung in Plots mit mehreren Kurven (DE) pdf
*  Graphen und Objekte bewegen mit der "Nudge"-Funktion (DE) pdf
April 2009 pdf
*  User-defined transforms - useful feature of SigmaPlot pdf
*  Histogramme mit unregelmäßigen Intervallgrenzen (DE) pdf
September 2008 pdf
*  Artikel: "PeakFit: Die Dekonvolution als Methode zur Quantifizierung überlagerter chromatographischer Peaks" (DE) pdf
*  Artikel: "Kardiologische Forschungsdaten auswerten und effektvoll präsentieren mit SigmaPlot" (DE) pdf
*  Graphen mit mehreren Achsunterbrechungen (DE) pdf
*  3D-Balkendiagramm mit "Fehlerbalken" (DE) pdf

Top ↑ TechTips, by Subject »


Kurztipp

Zoom im Datenarbeitsblatt

Mit den Zoom-Werkzeugen in der unteren rechten Ecke von SigmaPlot (z.B. dem Schieberegler) können Sie nicht nur die Graphseite stufenlos vergrößern und verkleinern, sondern auch das Datenarbeitsblatt.
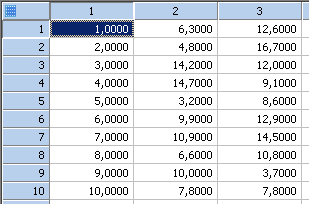
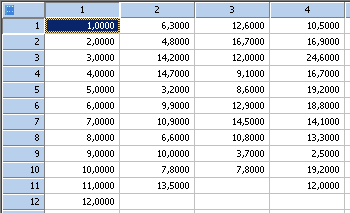
worksheet zoom 1

worksheet zoom 1

zoom slider


Mehr Kurztipps »


Demo-Download


SigmaPlot     SigmaStat     SYSTAT     TableCurve 2D     TableCurve 3D     PeakFit     SigmaPlot EK-Modul     SigmaPlot-Module    


Tel: +49 (0) 211-5403 9646
© Systat Software GmbH 2023
E-Mail: saveskontakt@inpixon.com