

Die Datei Samples.jnb enthält in über 30 Sections Beispiele von SigmaPlot-Graphen. Sie finden die Datei im Help-Menü > "SigmaPlot Sample Graphs".
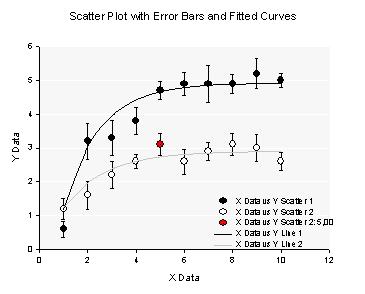
Example 1:
Scatter Plot with Error Bars and Fitted Curves
Graph with 2 plots
Plot 1: Multiple Error Bars, XY Pairs
Plot 2: Multiple Spline Curves, X Many Y
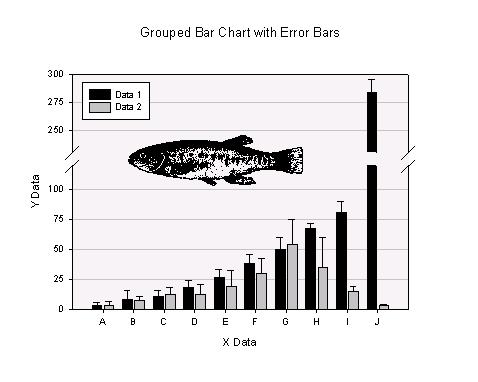
Example 2:
Grouped Bar Chart with Error Bars
Plot type: Grouped Error Bars
Data format: X, Many Y Replicates
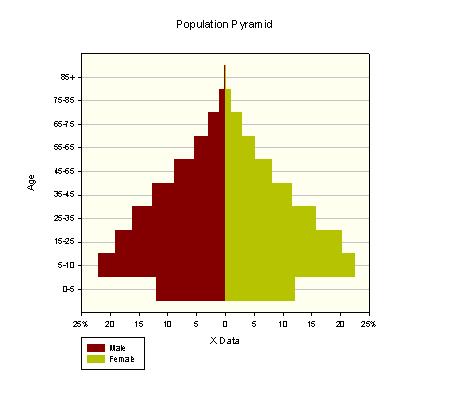
Example 3:
Population Pyramid
Plot type: Stacked Bars
Data format: Y Many X
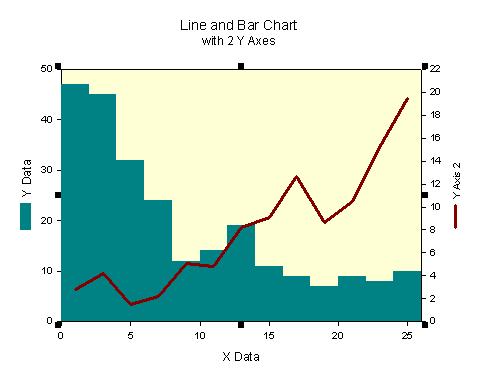
Example 4:
Bar and Line Chart with Two Y Axes
Plot 1: Bar Chart, Simple Bar, XY Pair
Plot 2: Line Plot, Simple Straight Line, XY Pair
Example 5:
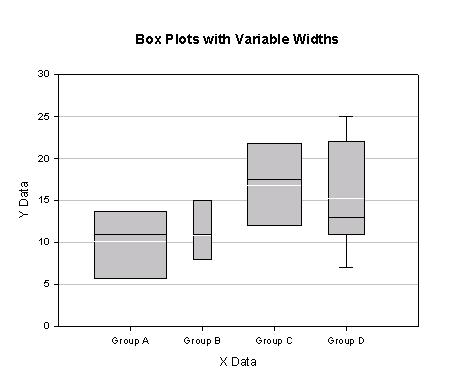
Box Plots with Variable Widths
Plot type: Vertical Box Plot
Data format: X Many Y
Example 6:
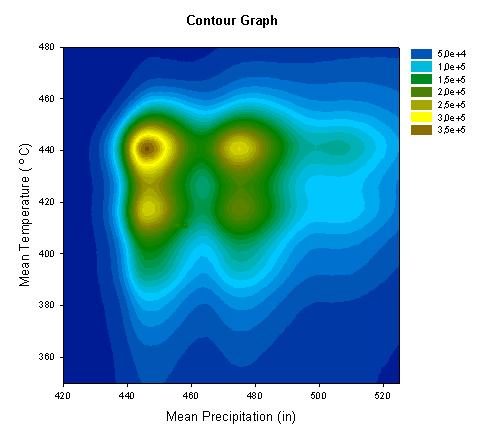
Color Contour Graph
Plot type: Filled Contour Plot
Data format: XY Many Z
Example 6:
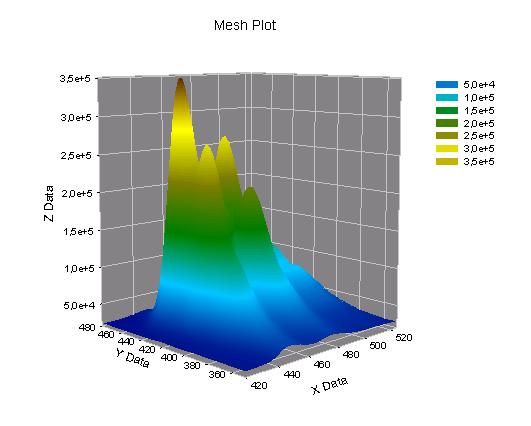
Mesh Plot
Plot type: 3D Mesh Plot
Data format: XY Many Z
Example 7:
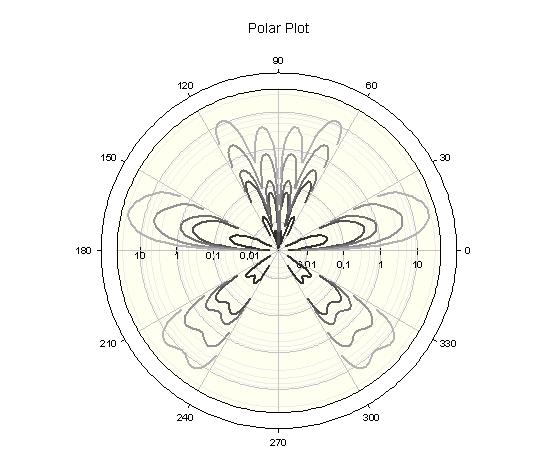
Polar Plot
Plot type: Polar Plot, Lines
Data format: Theta Many R
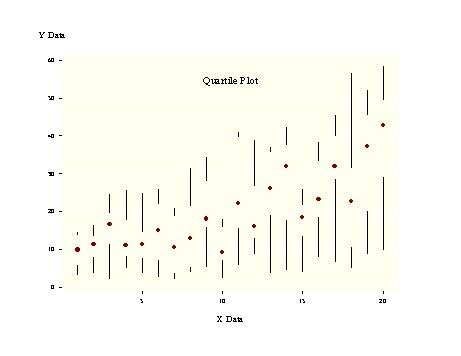
Example 8:
Quartile Plot
Plot 1: Multiple Error Bars, X Many Y (Black symbols and error bar lines)
Plot 2: Multiple Error Bars, X Many Y (Dk. Red symbols and error bar "gaps":)
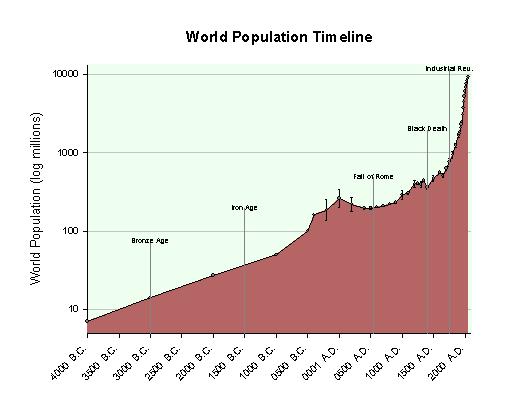
Example 9:
World Population Timeline
Plot type: Grouped Error Bars
Data format: X, Many Y Replicates
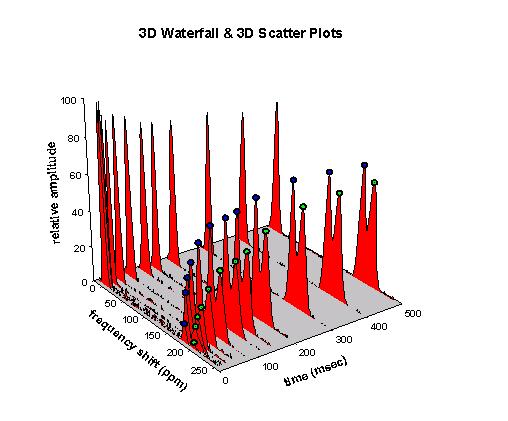
Example 10:
3D Waterfall & 3D Scatter Plots
2 Plots in Graph
Plot 1: 3D Waterfall Plot, XY Many Z
Plot 2: 3D Scatter Plot, XYZ Triplet
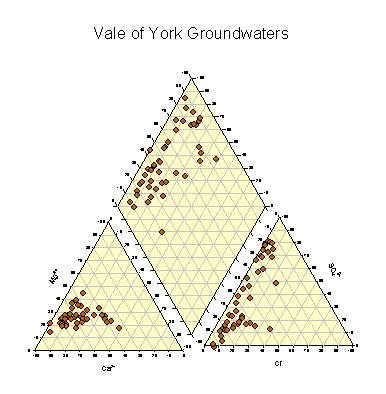
Example 11:
Piper Plot
4 Graphs on the Page
Graph 1: Scatter, Ternary Triplet
Graph 2: Scatter, Ternary Triplet
Graph 3: Ternary, XY Pairs
Graph 4: 3 Plots, Simple Scatter, XY Pair
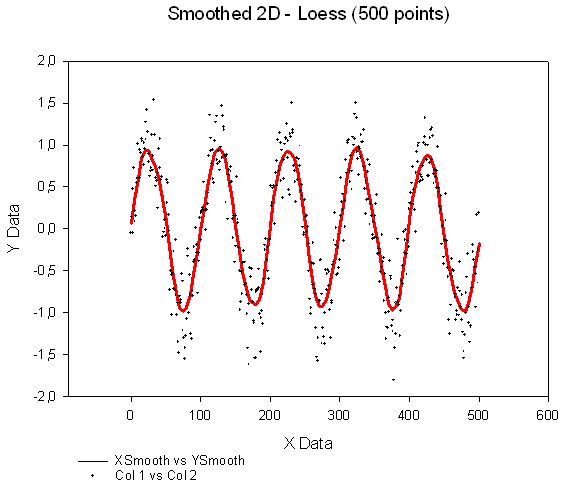
Example 12:
2D Smoothed 500 - Loess
Plot 1: Simple Straight Line, XY Pair
Plot 2: Simple Scatter, XY Pair
(-> Analysis > Smoothers)
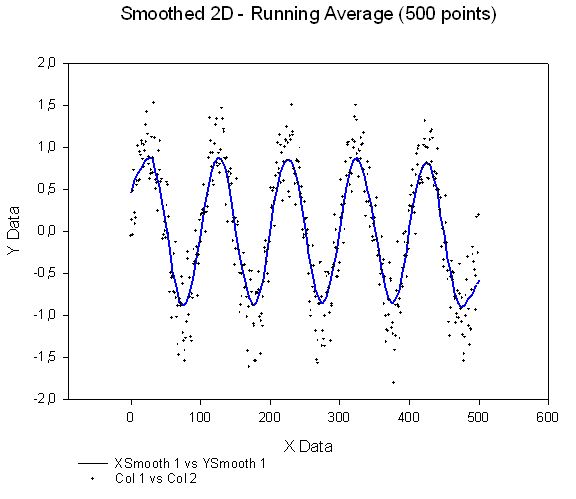
Example 12:
2D Smoothed 500 - Running Average
Plot 1: Simple Straight Line, XY Pair
Plot 2: Simple Scatter, XY Pair
(-> Analysis > Smoothers)
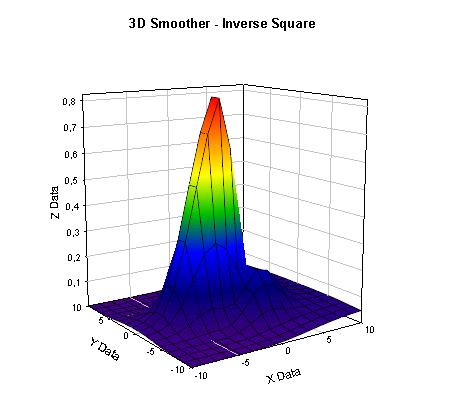
Example 13:
3D Smoothed - Inverse Square
Plot 1: Simple Straight Line, XY Pair
Plot 2: Simple Scatter, XY Pair
(-> Analysis > Smoothers)
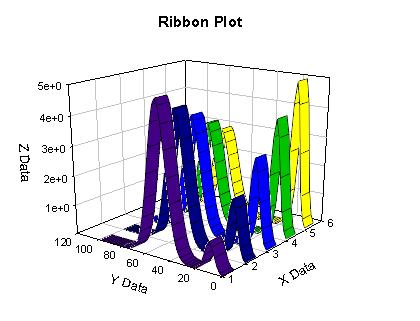
Example 14:
Ribbon Plot
Plot 1: 3D Mesh Plot, XYZ Triplet
Plot 2: 3D Mesh Plot, XYZ Triplet
Plot 3: 3D Mesh Plot, XYZ Triplet
Plot 4: 3D Mesh Plot, XYZ Triplet
Plot 5: 3D Mesh Plot, XYZ Triplet
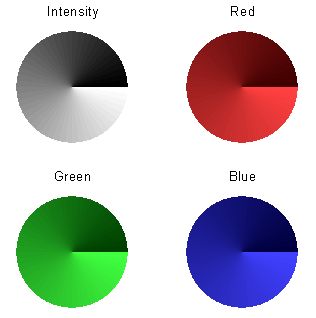
Example 15:
Color Wheels
Pie Chart, Single Column
Graph 1: Intensity
Graph 2: Red
Graph 3: Green
Graph 4: Blue
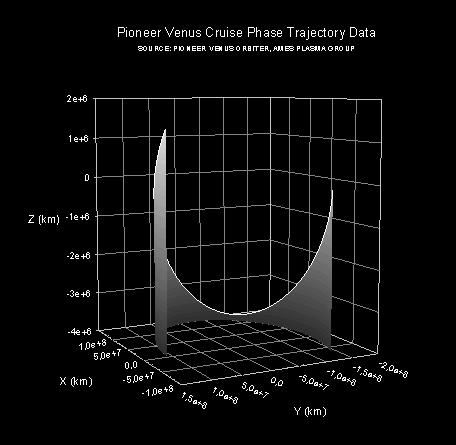
Example 16:
Trajectory Plot
Plot type: 3D Trajectory Plot
Data format: XYZ Triplet
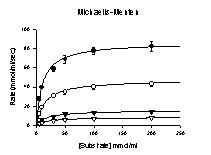
Example 17:
Enzyme Kinetics Graphs: Michaelis-Menten
Plot 1-4: Simple Error Bars, X, Many Y Replicates
Plot 5: Multiple Straight Lines, X Many Y
(-> ToolBox > Enzyme Kinetics macro)
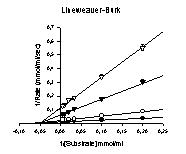
Example 17:
Enzyme Kinetics Graphs: Lineweaver-Burk
Plot 1-4: Simple Error Bars, X, Many Y Replicates
Plot 5: Multiple Straight Lines, X Many Y
(-> ToolBox > Enzyme Kinetics macro)
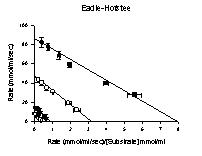
Example 17:
Enzyme Kinetics Graphs: Eadie-Hofstee
Plot 1-4: Simple Error Bars, X, Many Y Replicates
Plot 5: Multiple Straight Lines, X Many Y
(-> ToolBox > Enzyme Kinetics macro)
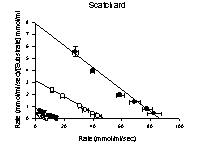
Example 17:
Enzyme Kinetics Graphs: Scatchard
Plot 1-4: Simple Error Bars, X, Many Y Replicates
Plot 5: Multiple Straight Lines, X Many Y
(-> ToolBox > Enzyme Kinetics macro)
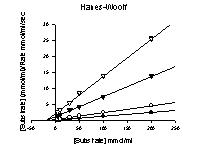
Example 17:
Enzyme Kinetics Graphs: Hanes-Woolf
Plot 1-4: Simple Error Bars, X, Many Y Replicates
Plot 5: Multiple Straight Lines, X Many Y
(-> ToolBox > Enzyme Kinetics macro)
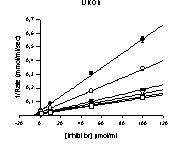
Example 17:
Enzyme Kinetics Graphs: Dixon
Plot 1-4: Simple Error Bars, X, Many Y Replicates
Plot 5: Multiple Straight Lines, X Many Y
(-> ToolBox > Enzyme Kinetics macro)
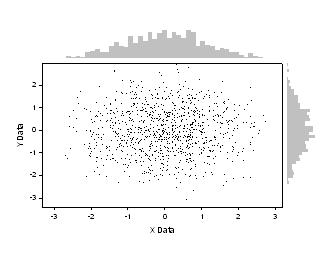
Example 18:
Border Plots, Histogram
Graph 1: Simple Scatter, XY Pair
Graph 2: Simple Bar, Single Y
Graph 3: Simple Bar, Single X
(-> ToolBox > Border Plots macro)
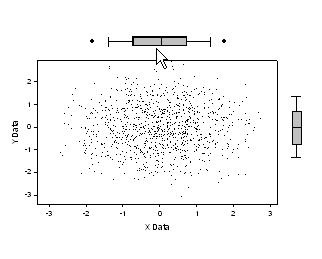
Example 18:
Border Plots, BoxPlot
Graph 1: Simple Scatter, XY Pair
Graph 2: Horizontal Box Plot, Many X
Graph 3: Vertical Box Plot, Many Y
(-> ToolBox > Border Plots macro)
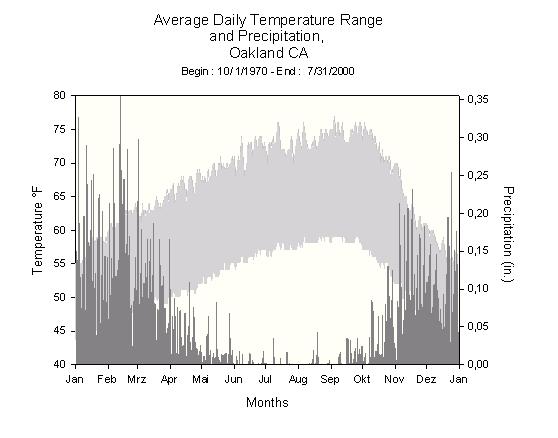
Example 19:
Climograph
Plot 1: Multiple Area, X Many Y
Plot 2: Simple Bar, XY Pair
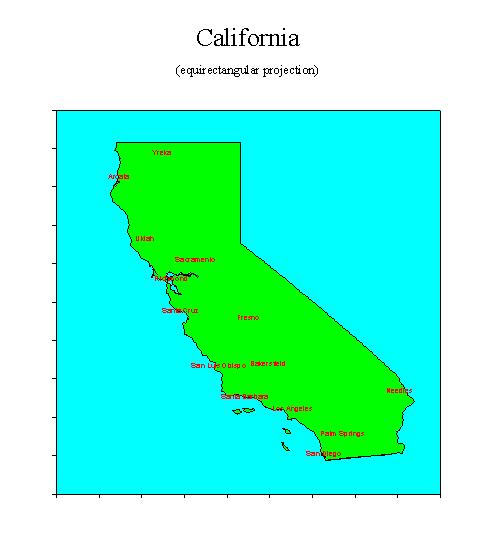
Example 20:
California Map
Plot 1, Borders: Vertical Area, YX Pair
Plot 2, Islands: Multiple Area, XY Pairs
Plot 3, Rivers (Hidden): Simple Straight Line, YX Pair
Plot 4, Cities: Simple Scatter, XY Pair
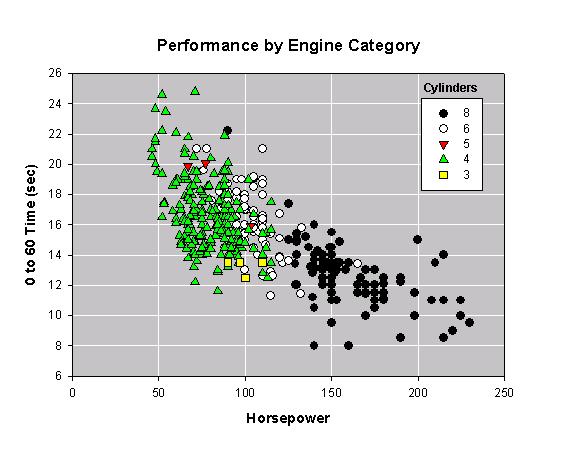
Example 21:
Category Graph
Plot type: Multiple Scatter
Data format: XY Category
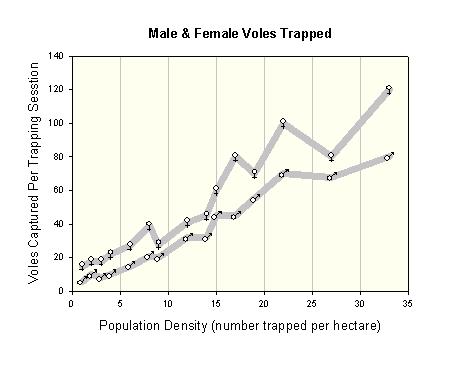
Example 22:
Symbols From a Column
Plot type: Multiple Straight Lines
Data format: X Many Y
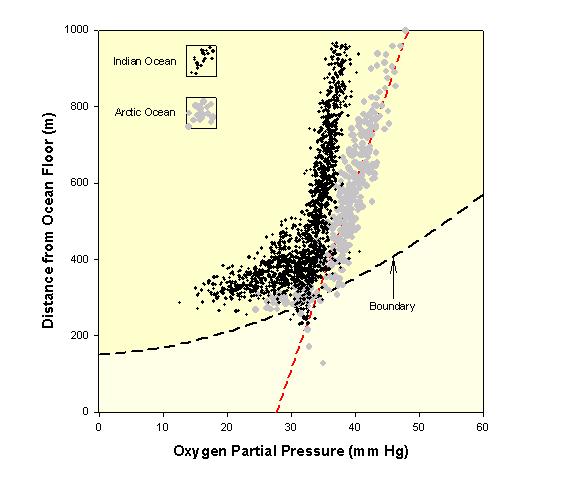
Example 23:
Area and Scatter Plots
Plot 1: Simple Straight Lines, XY Pair
Plot 2: Simple Area, XY Pair
Plot 3: Simple Regression, XY Pair
Plot 4: Simple Scatter, XY Pair
Plot 5: Simple Scatter, XY Pair
Plot 6: Simple Scatter, XY Pair
Plot 7: Simple Scatter, XY Pair
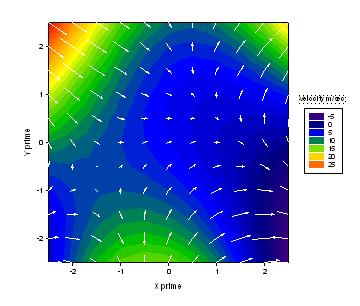
Example 24:
Vector Field Plus Contour
Graph 1: Filled Contour Plot, XYZ Triplet
Graph 2: Vector plot XYAM
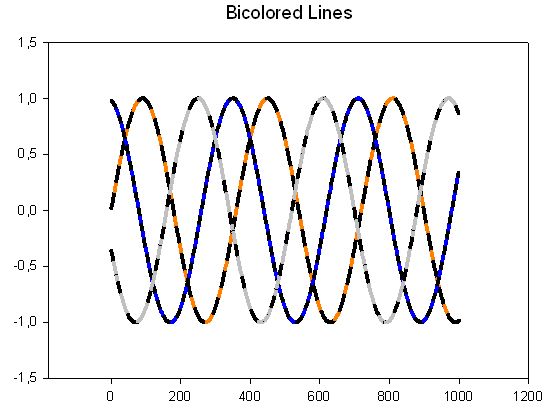
Example 25:
Bicolored Lines
Plot 1: Simple Straight Line, XY Pair
Plot 2: Simple Straight Line, XY Pair
Plot 3: Simple Straight Line, XY Pair
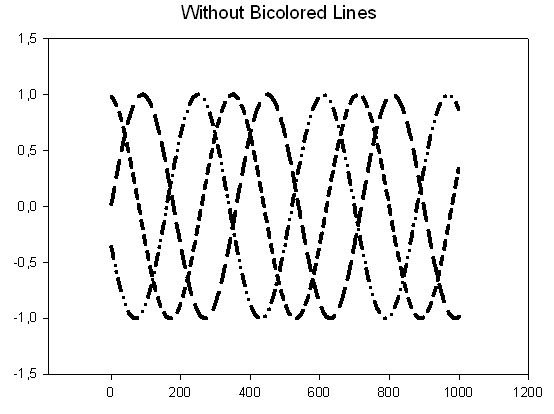
Example 25:
Bicolored Lines
Plot 1: Simple Straight Line, XY Pair
Plot 2: Simple Straight Line, XY Pair
Plot 3: Simple Straight Line, XY Pair
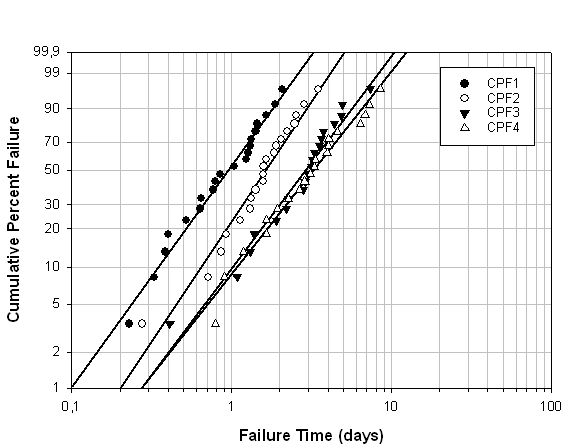
Example 26:
Weibull Failure Graph
Plot type: Multiple Regression
Data format: XY Pairs
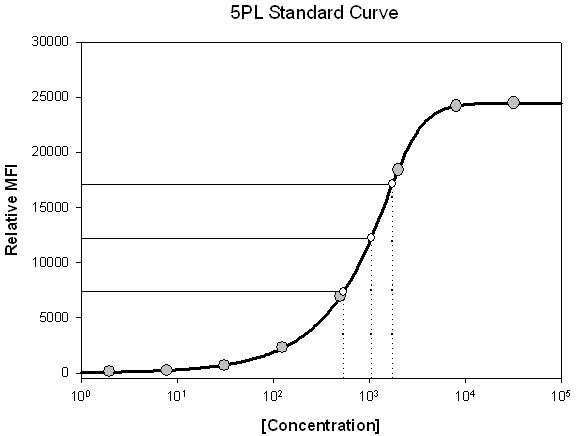
Example 27:
5PL Standard Curve
Plot 1: Simple Scatter, XY Pair
Plot 2: Simple Straight Line, XY Pair
Plot 3: Simple Scatter, XY Pair
(-> ToolBox > Standard Curves macro)
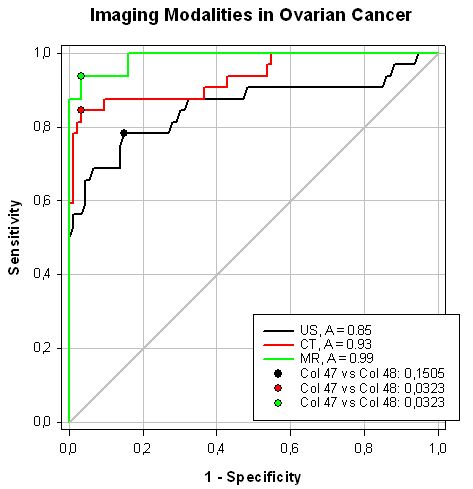
Example 28:
ROC Curves
Plot 1: Multiple Straight Lines, XY Pair
Plot 2: Simple Straight Line, XY Pair
Plot 3: Simple Scatter, XY Pair
(-> ToolBox > ROC Curves macro)
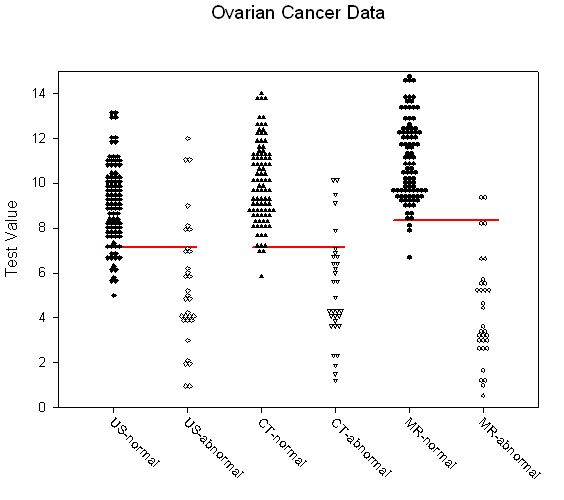
Example 28:
ROC Curves, Dot Histogram
Plot 1: Multiple Scatter, XY Pairs
Plot 2: Multiple Straight Lines, XY Pairs
(-> ToolBox > ROC Curves macro)
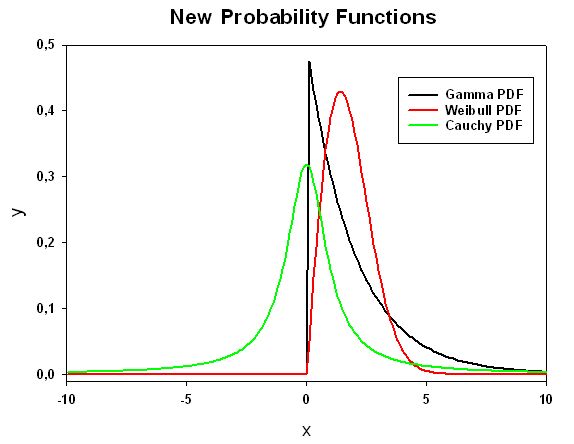
Example 29:
Probability Functions: Gamma, Weibull, Cauchy
Plot type: Multiple Straight Lines
Data format: X Many Y
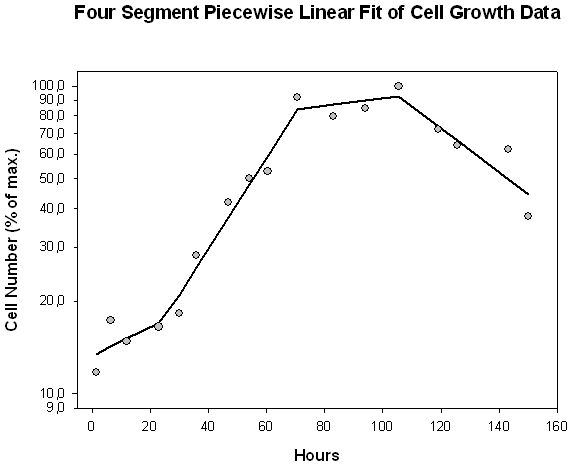
Example 30:
Piecewise Linear Fit
Plot 1: Simple Scatter, XY Pair
Plot 1: Simple Straight Line, XY Pair
(-> Analysis > Regression Wizard > Equation Category > Piecewise)
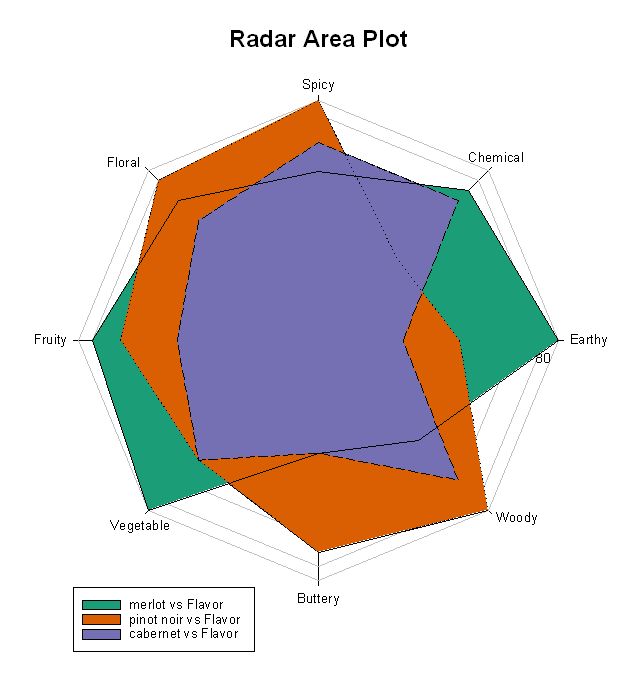
Example 31:
Radar Area
Plot type: Radar Area
Data format: XY Pair
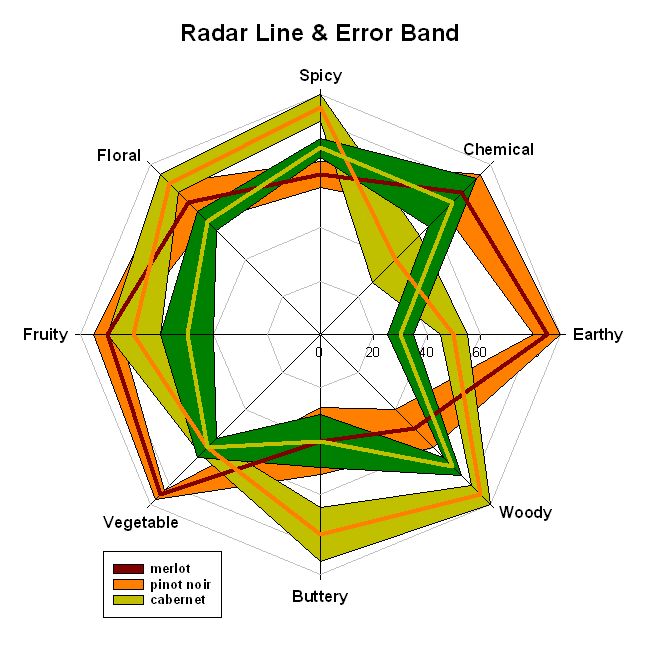
Example 31:
Radar Line and Error Band
Plot type: Radar Line and Error Band
Data format: Label Many Series Error
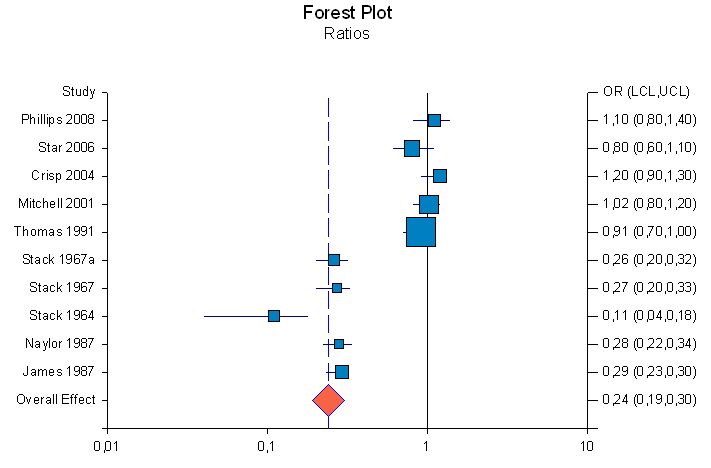
Example 32:
Forest Plot Ratios
Plot type: Forest Plot
Data format: Mean difference
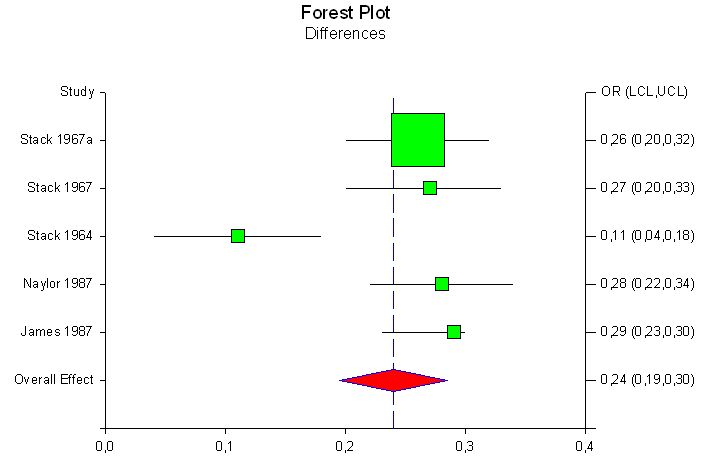
Example 32:
Forest Plot Differences
Plot type: Forest Plot
Data format: Mean difference
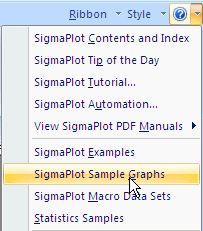
Sie können die Datei Samples.jnb vom Help-Menü aus öffnen.
Sie liegt im Benutzerverzeichnis: Dokumente\SigmaPlot\SPW14\Samples.
Eine "Masterkopie" finden Sie im Verzeichnis Programme\SigmaPlot\SPW14\Samples.