|
|
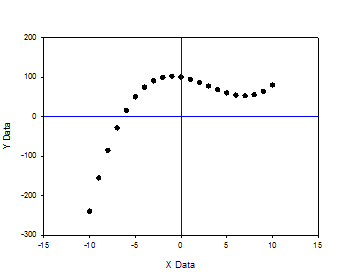
Data Table from an Equation
How do you create a data table from an equation
- to present and export the values
- to plot the data
We will look at these features in SigmaPlot
- 1. Linear Regression
- 2. Regression Wizard
- 3. Plot Equation
- 4. User-Defined Transforms

[PDF]

Editing a Graph Gallery Graph
Did you know...
that you can easily modify the graphs in the Graph Gallery with a right-click > Edit?
The Graph Gallery – on the left side of the screen, below the Notebook Manager – holds graphs which you can easily use
as a model for further graph creation. Turn it on or off in the Home ribbon > Navigate > Gallery pane.
There are several graphs in the Gallery when you have installed SigmaPlot. You can easily add graphs by dragging
them from the graph page to the Gallery pane. The graph becomes an icon in the Gallery, its title becomes the caption.
To create a new graph from this model, double-click on the icon, and follow the Create Graph dialog.
To modify one of the Gallery graphs, just right-click on it, and select Edit. It opens on a new graph page. You can
modify it in the Graph Properties, and when you save it, it is updated in the Graph Gallery.

TechTips topics? If you would like to see TechTips about certain topics please let us know.

|

