|

Systat Software Online-Seminar
"SigmaPlot 12 - Von Daten zur Präsentation", Mittwoch, 18. Januar 2012, 14 Uhr
"SigmaPlot 12 - From Data to Presentation", Wednesday, 18th January 2012, 11 AM (English)
"SigmaPlot 12 - Von Daten zur Präsentation", Mittwoch, 15. Februar 2012, 14 Uhr
"SigmaPlot 12 - From Data to Presentation", Wednesday, 15th Februar 2012, 11 AM (English)

|
|
|
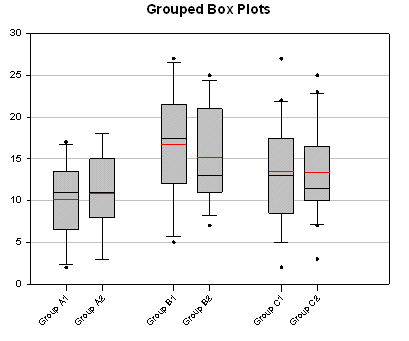
Grouped Box Plots
To create a grouped box plot, use an X many Y box plot, and choose the X values accordingly.
[PDF]


Arranging data worksheet and graph page
In SigmaPlot 12, you can arrange data worksheets and graph pages as cascading, tiled, and tabbed windows. In tabbed mode, you can create groups which let you work conveniently on data and corresponding graph pages.
[PDF]

The Menu To Ribbon Utility
From www.sigmaplot.com/downloads/download.php, you can download the Menu To Ribbon Utility. This utility helps users in transitioning from
the menus used in SigmaPlot 11 to the new ribbon interface used in SigmaPlot 12.
[PDF]

Macro: Add the notebook file name to the graph page
You can add the notebook file name to the graph page (or the complete drive + path + notebookname).
[PDF]

|

